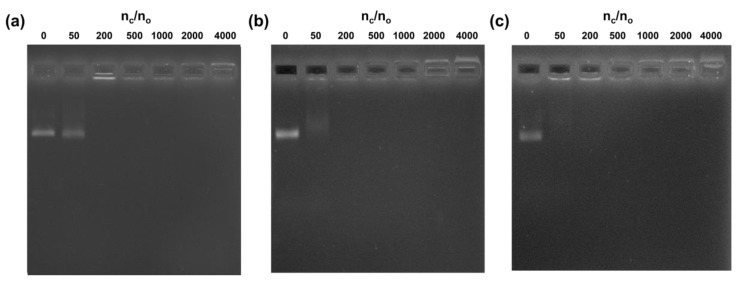
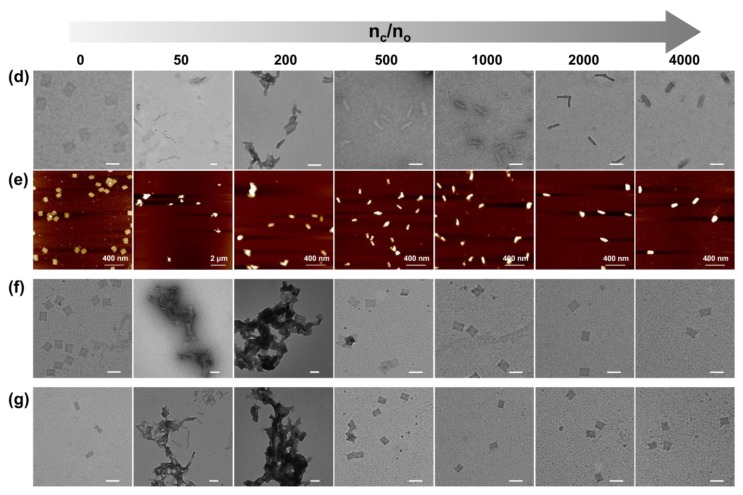
Figure 2.
Gel EMSA and TEM, AFM micrographs of the samples. (a) Agarose gel EMSA of Orig1 and coated Orig1 with increasing ratios of nc/no; (b) Gel EMSA of Orig2 and coated Orig2 with increasing ratios; (c) Gel EMSA of Orig3 and coated Orig3 with increasing ratios; (d) TEM images of Orig1 and coated Orig1 with increasing ratios of nc/no; (e) AFM images of Orig1 and coated Orig1 with increasing ratios; (f) TEM images of Orig2 and coated Orig2 with increasing ratios of nc/no; (g) TEM images of Orig3 and coated Orig3 with increasing ratios of nc/no, scale bar in all TEM images is 100 nm.


