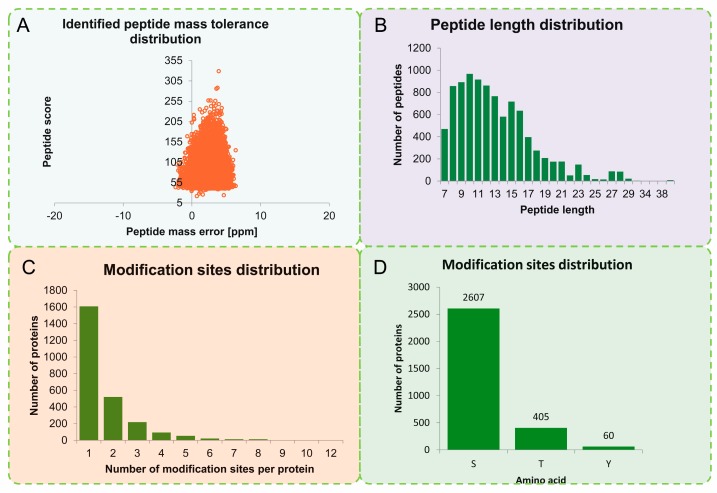
Figure 1.
Quality control (QC) validation of mass spectrometer (MS) data. (A) Mass error distribution of all identified phosphorylated peptides. (B) Length distribution of all identified phosphorylated peptides. (C) Modification phosphorylated sites distribution of all identified peptides. (D) The distribution of phosphosites between serine (S), threonine (T), and tyrosine (Y) residues.

