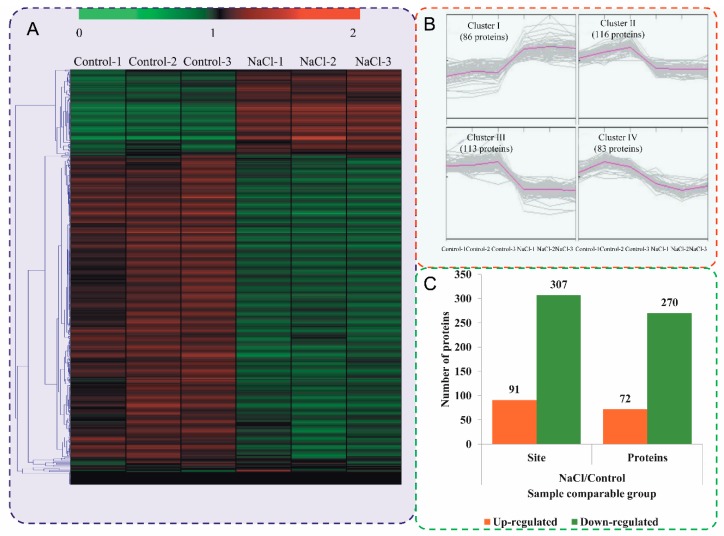
Figure 3.
Impacts of salt stress treatment on phosphorylation proteome levels in okra. (A) Expression profiles of the DPPs in response to salt stress. (B) All DPPs were analyzed and clustered into four major Clusters by K-means method. (C) The numbers of up- and downregulated phosphorylated proteins and phosphorylated sites in the salt treatment seedlings compared to the control seedlings.

