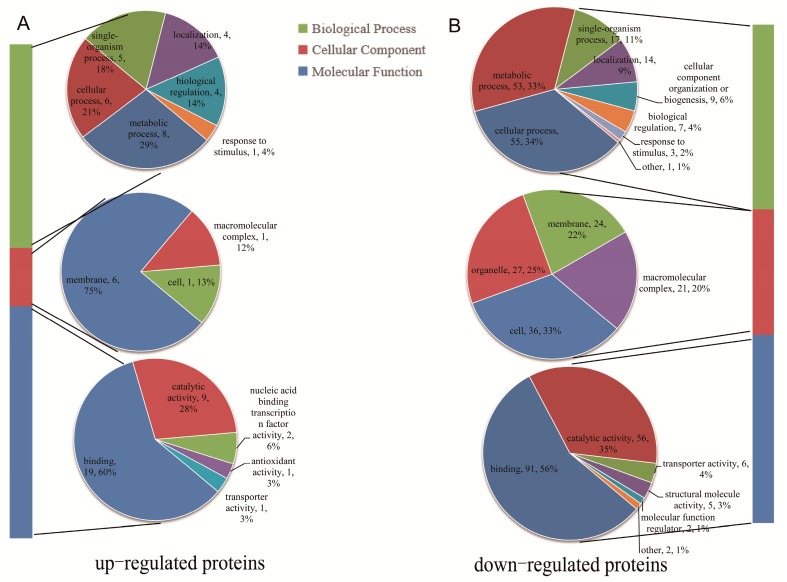
Figure 4.
GO annotation analysis of DPPs. Distribution of the upregulated (A) and downregulated (B) proteins with GO annotation. Different color blocks represented different terms, including cellular component, molecular function, and biological process. Number of the upregulated proteins in each second level term was showed in a pie chart.

