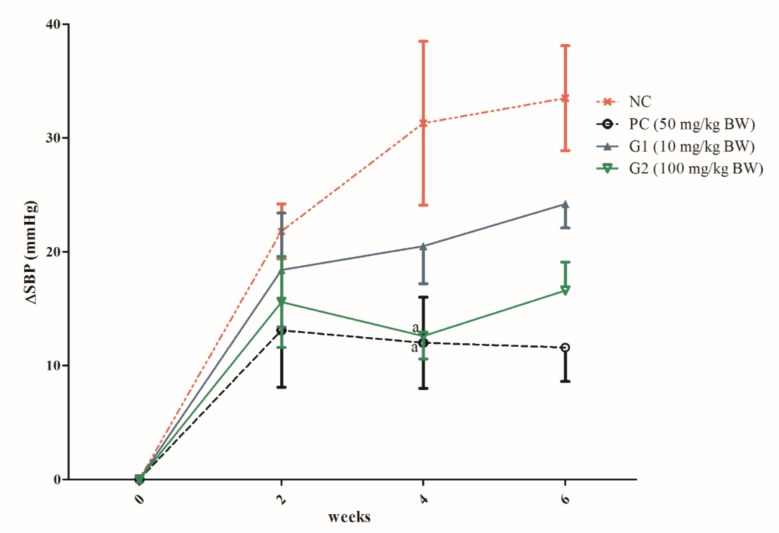
Figure 4.
Systolic blood pressure changes from the baseline are expressed in absolute values (mmHg) and data are mean ± SEM from 5 determinations. Data points with the same alphabets are not significantly different (a p > 0.05) using one-way ANOVA followed by Duncan tests. NC: Negative control, PC: Positive control, G1: Group 1, G2: Group 2.

