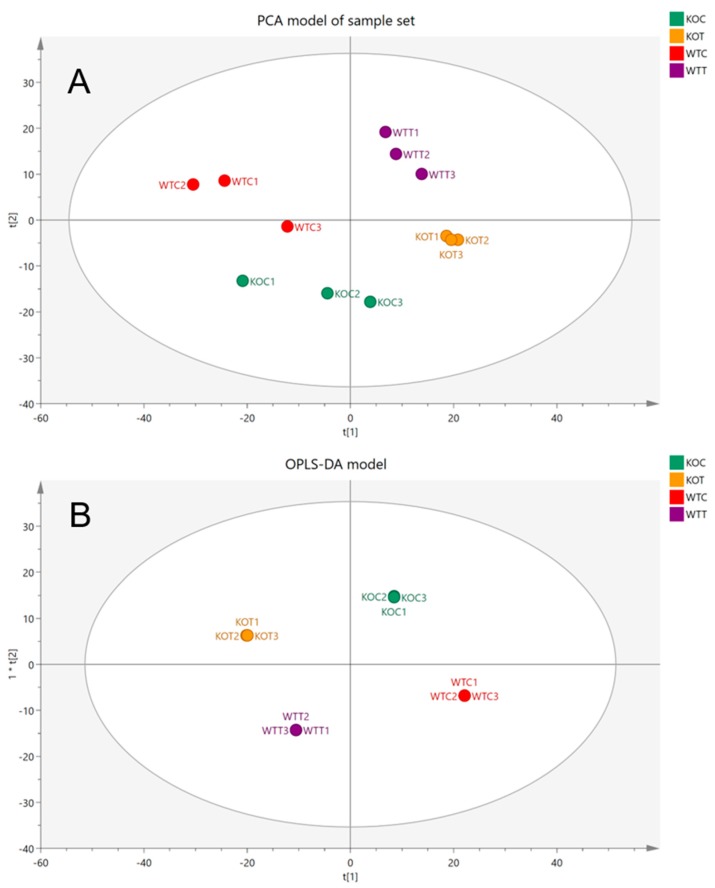
Figure 1.
(A) Principal components analysis (PCA) plots of four different groups: WTC, wildtype control cells without treatment of oxLDL; WTT, wildtype cells treated with oxLDL; KOC, TSPO knockout control cells without treatment of oxLDL; KOT, TSPO knockout cells treated with oxLDL. (B) OPLS-DA score plots the samples according to their classification colored based on their group and the reading of 1106 putative metabolites.

