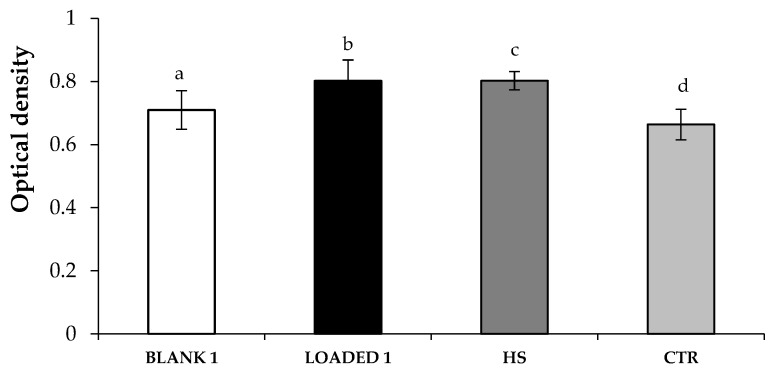
Figure 8.
Optical density values measured after cell treatment with the samples (diluted 1:1 v/v in CM) for 24 h and, then, with H2O2 (1.25 mM) for other 24 h. Cells subjected to the oxidative stress in absence of the samples were considered as control (CTR) (mean values ± s.e.; n = 3). Anova one-way, Multiple Range Test (p < 0.05): b vs d; c vs d.

