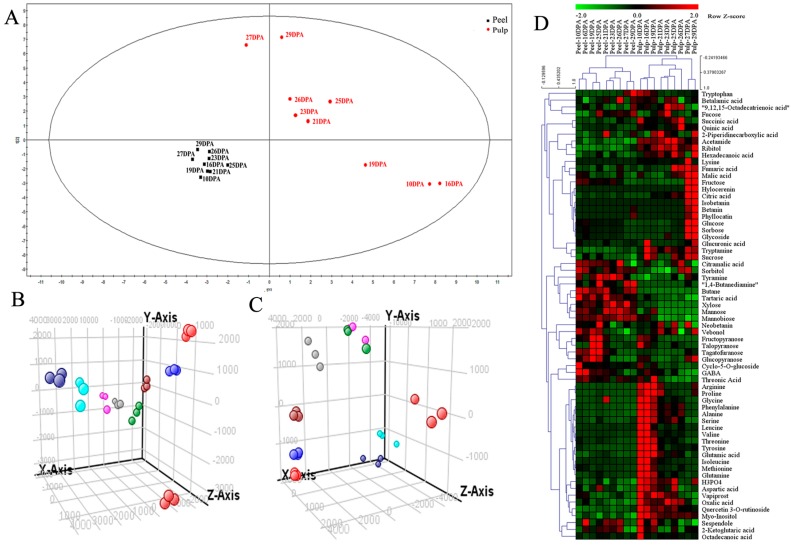
Figure 4.
Principal component analysis (PCA) score plots and metabolite hot map derived from nontargeted metabolome profiling. (A) Metabolite PCA from the GC–MS of fruit peel and pulp; metabolite PCA from the LC−MS of fruit (B) peel and (C) pulp (bright-red dots, 10 DPA; blue dots, 16 DPA; red-brown dots, 19 DPA; gray dots, 21 DPA; green dots, 23 DPA; pink dots, 25 DPA; dark-red dots, 26 DPA; bright-blue dots, 27 DPA; dark-blue dots, 29 DPA); (D) metabolite heat map from GC–MS and LC–MS/MS.

