
Figure 3.
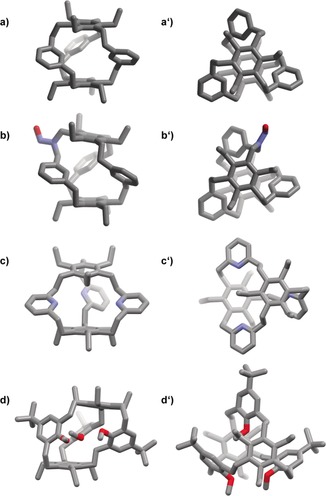
Solid‐state structures of 8 a (a: side view and a′: top view), 9 (b and b′), 8 b (c and c′), and 8 c (d and d′), determined by single‐crystal X‐ray diffraction. Note: hydrogen atoms and solvate molecules are omitted for clarity. Depicted is only one enantiomer of the racemic mixture, each. For crystallographic details, see the Supporting Information.