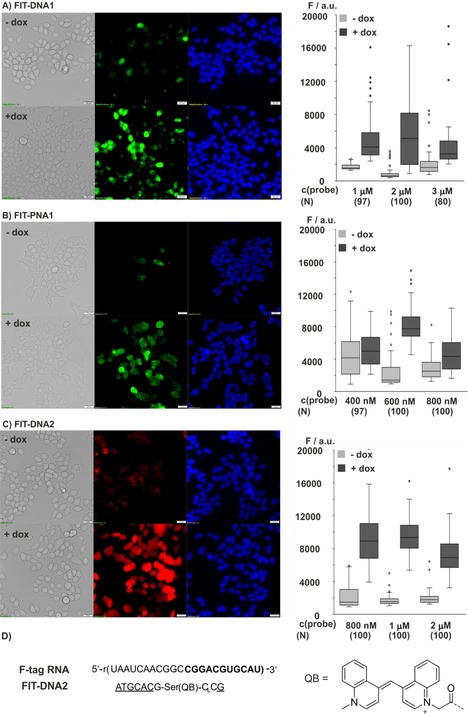
Figure 6.

Fluorescence and bright‐field (gray) microscopy images of Flp‐In 293 T‐REx cells after SLO‐induced delivery of A) FIT‐DNA1, B) FIT‐PNA1, and C) FIT‐DNA2 without (−dox) and with (+dox) induction of F‐tagged mCherry mRNA. The Box‐Whisker plots (1.5 IQR) show the signal intensity of Dox‐induced cells (dark gray) and noninduced cells (light gray) measured by means of image analysis (Figure S16) at varied probe concentrations. The number, N, of cells analyzed is given in brackets. Conditions: 2 μg mL−1 Dox (if added); after 1 h cells are permeabilized with 150 U mL−1 SLO for 10 min in PBS+1 mm MgCl2 at 37 °C and 5 % CO2 in the presence of FIT probes. Green: TO emission; red: QB emission; blue: Hoechst 33342 nucleus stain. Filter sets: TO λ ex=500/24 nm, TO λ em=545/40 nm; QB λ ex=575/25, QB λ em=628/40 nm; Hoechst 33342=350/50 nm. Scale bar: 20 μm.
