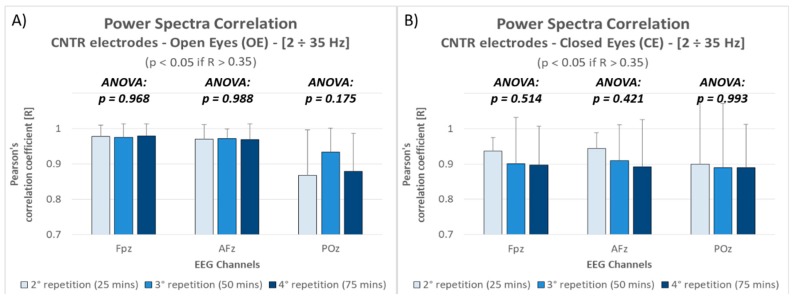
Figure 3.
The bar graph represents the mean and the standard deviation of the Pearson’s correlation coefficients between the first and the three following repetitions, for each electrode position, during the Open Eyes (A) and Closed Eyes (B) conditions. The p-values of the ANOVAs performed for each comparison are reported within the graphs.

