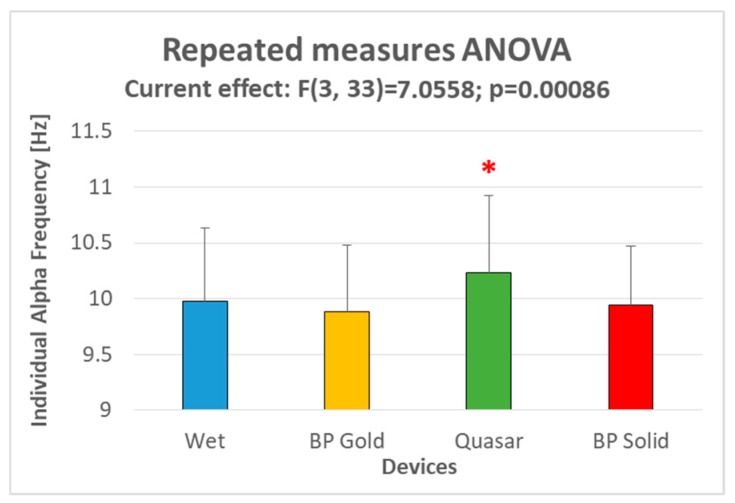
Figure 4.
The bar graph represents the mean and the standard deviation of the IAF values estimated during the CE condition through the four different electrode types. The red asterisk indicates the sample significantly (p < 0.05) different from the other ones, as demonstrated by the Duncan’s post-hoc test.

