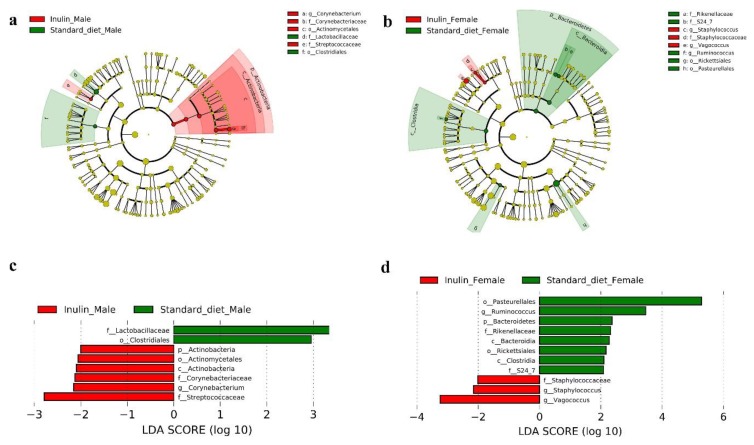
Figure 7.
Cladogram and linear discriminant analysis (LDA) scores indicating significant differences in gut microbiota in InRp5545/TM3 D. melanogaster fed an inulin-supplemented diet or a standard diet. (a) Cladogram of male flies on the inulin and standard diet; (b) Cladogram of male and female flies on the inulin-supplemented diet; (c) LDA scores of male flies on the inulin and standard diet; (d) LDA scores of male and female flies on the inulin-supplemented diet.

