Figure 2.
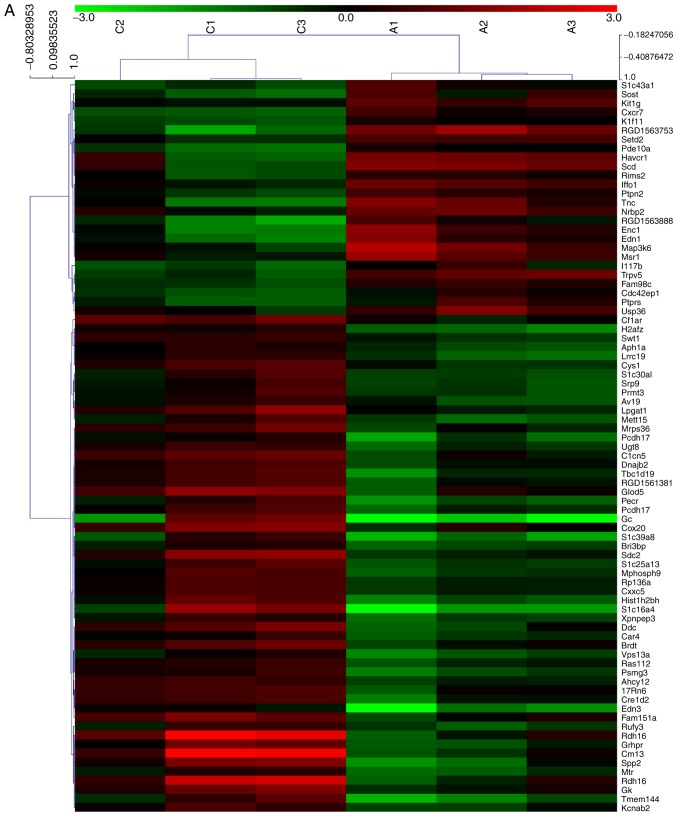
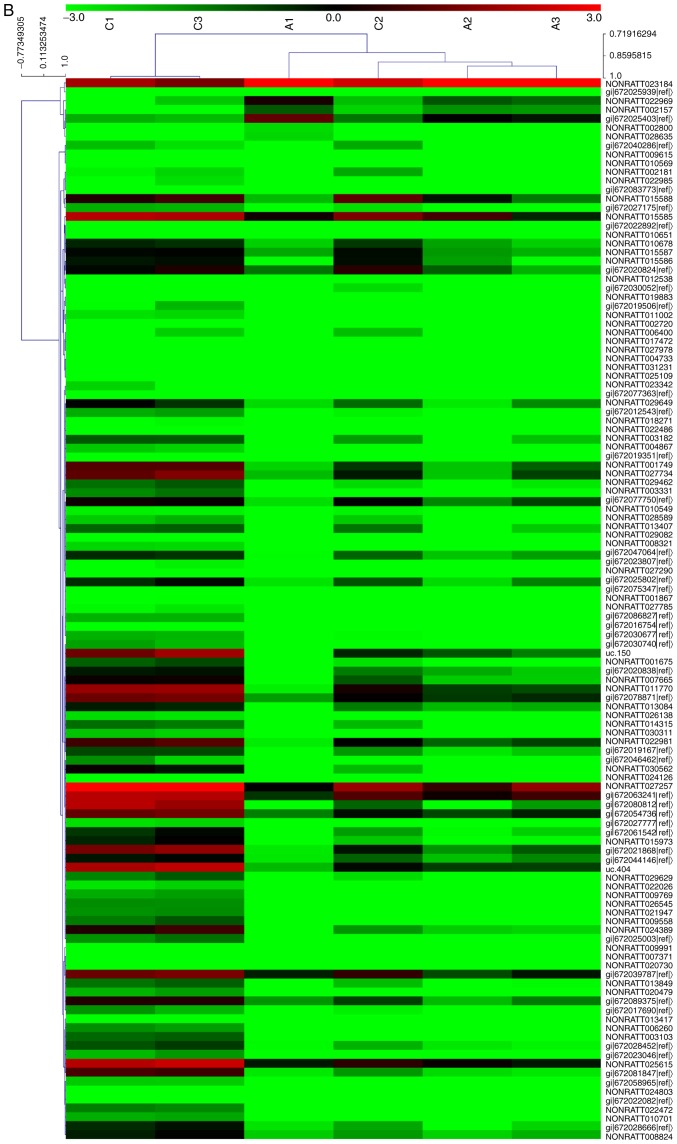
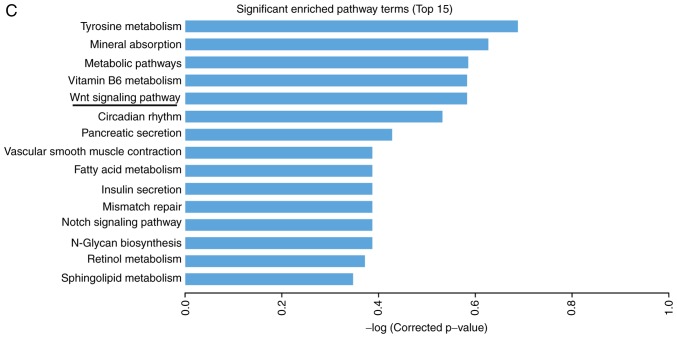
mRNA + lncRNA microarray analysis of kidney allograft tissues. (A) Clustering analysis of the mRNAs revealed that 81 mRNAs were significantly differentially expressed (FC>2.0; P<0.05) between the CAN group (C1-3) and the AMD3100 group (A1-3). mRNA + lncRNA microarray analysis of kidney allograft tissues. (B) Cluster analysis of lncRNAs demonstrated that 140 lncRNAs were significantly differentially expressed (FC>2.0; P<0.05) between the two groups. mRNA + lncRNA microarray analysis of kidney allograft tissues. (C) The top 15 pathways suggested by the Kyoto Encyclopedia of Genes and Genomes pathway analysis. FC, fold change; CAN, chronic allograft nephropathy; lncRNA, long noncoding RNA.


