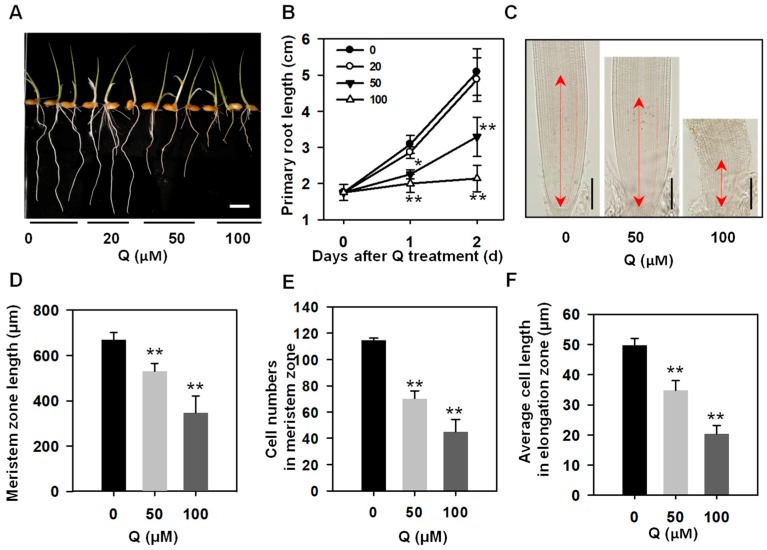
Figure 1.
The effect of quercetin on rice root growth. (A) The rice root growth phenotype with 0, 20, 50, or 100 μM of quercetin (Q) treatment. Photos were taken after treatment with different concentration of quercetin for two days. Bar = 1 cm. (B) Time course of the primary root length of the rice seedlings treated with quercetin. Values are means ± standard deviation (SD; n = 60). The asterisks indicate a significant difference between the control and quercetin-treated plants at an indicated time (Student’s t test, * p < 0.05, ** p < 0.01). (C) Size of the root meristem with 0, 50, or 100 μM of quercetin treatment for two days. Double-headed arrow indicates the meristem zone. Bars = 200 μM. (D) The meristem zone length with 0, 50, or 100 μM quercetin treatment for two days. Values are means ± SD (n = 10). (E) The cell numbers in the meristem zone with 0, 50, or 100 μM quercetin treatment for two days. Values are means ± SD (n = 10). (F) Average cell length in the elongation zone with 0, 50, or 100 μM quercetin treatment for two days. Values are means ± SD (n = 10). The asterisks in (D–F) indicate a significant difference between the control and quercetin-treated plants (Student’s t test, ** p < 0.01).

