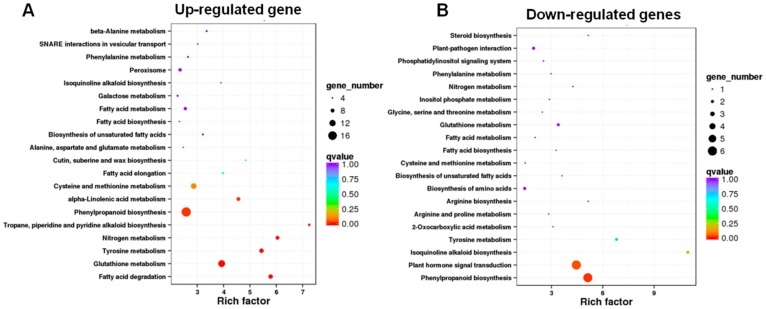
Figure 4.
The Kyoto Encyclopedia of Genes and Genomes (KEGG) pathway enrichment scatter plot of DEGs. (A) KEGG pathway enrichment analysis for up-regulated genes. (B) KEGG pathway enrichment analysis for down-regulated genes. The x-axis indicates the rich factor, and the degree of KEGG pathway enrichment. The y-axis indicates the name of the KEGG pathway. The dot size means the gene number. The dot color indicates the q-value. The top 20 KEGG pathways are shown.

