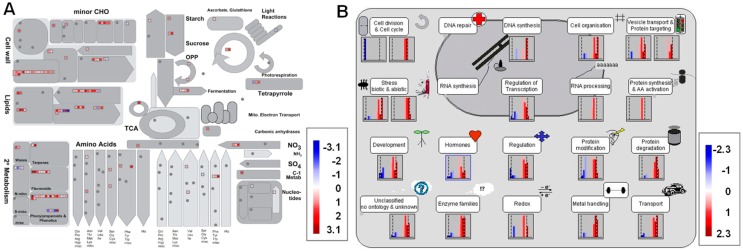
Figure 5.
MapMan overview of the DEGs in the quercetin-treated rice roots. (A) The metabolism overview in MapMan. (B) The cell functions overview in MapMan. The DEGs were binned to the MapMan functional categories. The values are the log2 fold changes. The up-regulated and down-regulated genes are represented with red and blue squares, respectively. Details about the genes are shown in Table S8.

