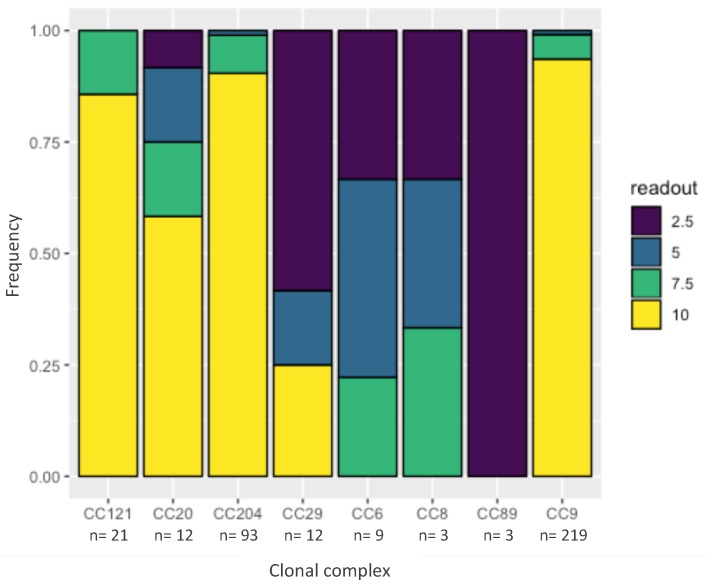
Figure 3.
Minimal inhibitory concentration (MIC) of benzalkonium chlorice (BC) by clonal complex. The y-axis represents frequency. The colors represent the highest concentration of BC (in μg/mL) at which confluent growth was observed after 48 h at 37 °C. The x-axis represents the different clonal complexes. n is the number of data points that were observed for each clonal complex.

