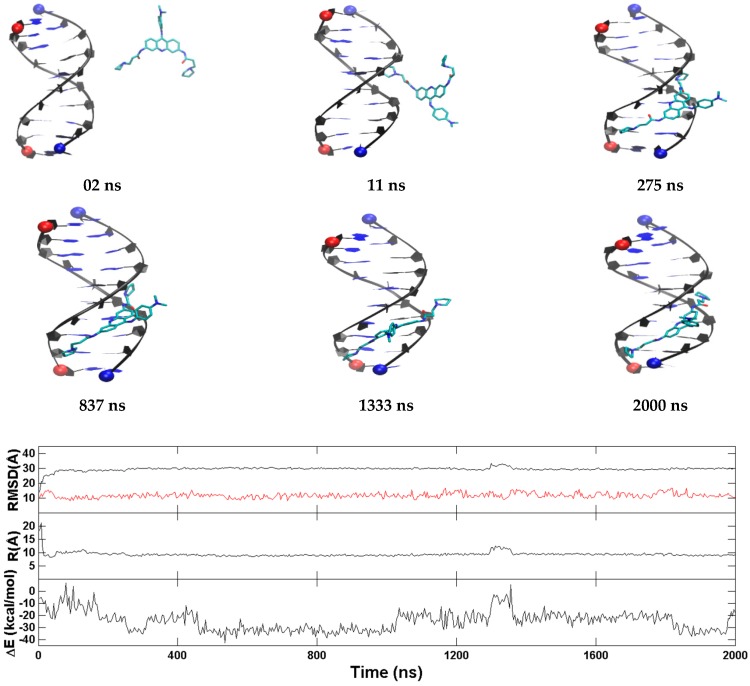
Figure 4.
A representative groove binding trajectory of the duplex DNA. (Top) Representative structures with time annotation. 5′ and 3′ are indicated by a red and blue ball, respectively. (Bottom) receptor (red) and ligand (black) RMSD relative to the original crystal pose, center-to-center distance and MM-GBSA binding energy (ΔG) (cf. methods section for definition).

