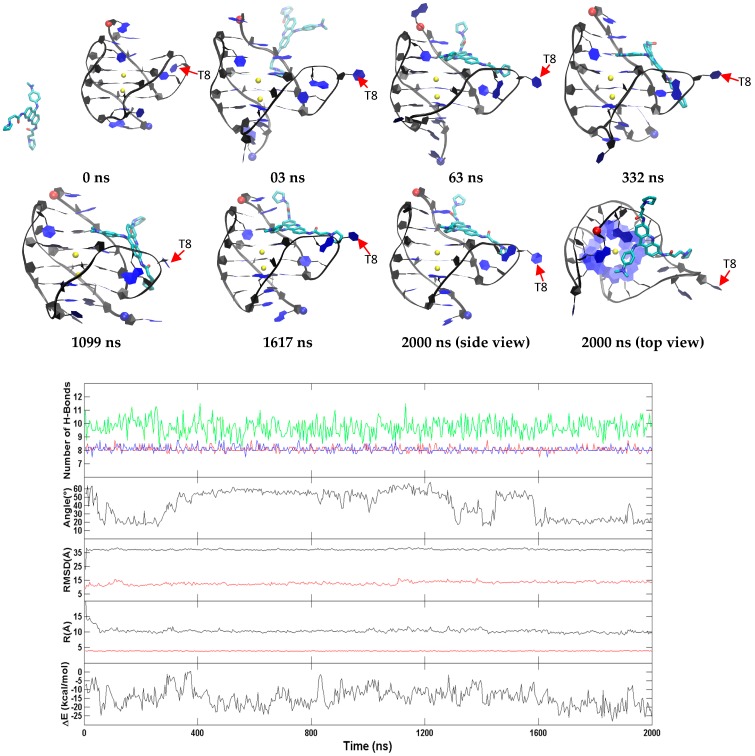
Figure 9.
A representative top binding trajectory of the hybrid G-quadruplex. (Top) Representative structures with time annotation. 5′ and 3′ are indicated by a red and blue ball, respectively. K+ ions are represented in yellow. (Bottom) An order parameter plot depicting number of hydrogen bonds present in first (red), second G4 (cyan), third G4 (blue), fourth G4 (black) and fifth (green) layers of the DNA structure, the drug-base dihedral angle, receptor (red) and ligand (black) RMSD relative to the original crystal pose, center-to-center distance (R/black) and K+-K+ distance (R/red) and MM-GBSA binding energy (ΔG) (cf. methods section for definition).

