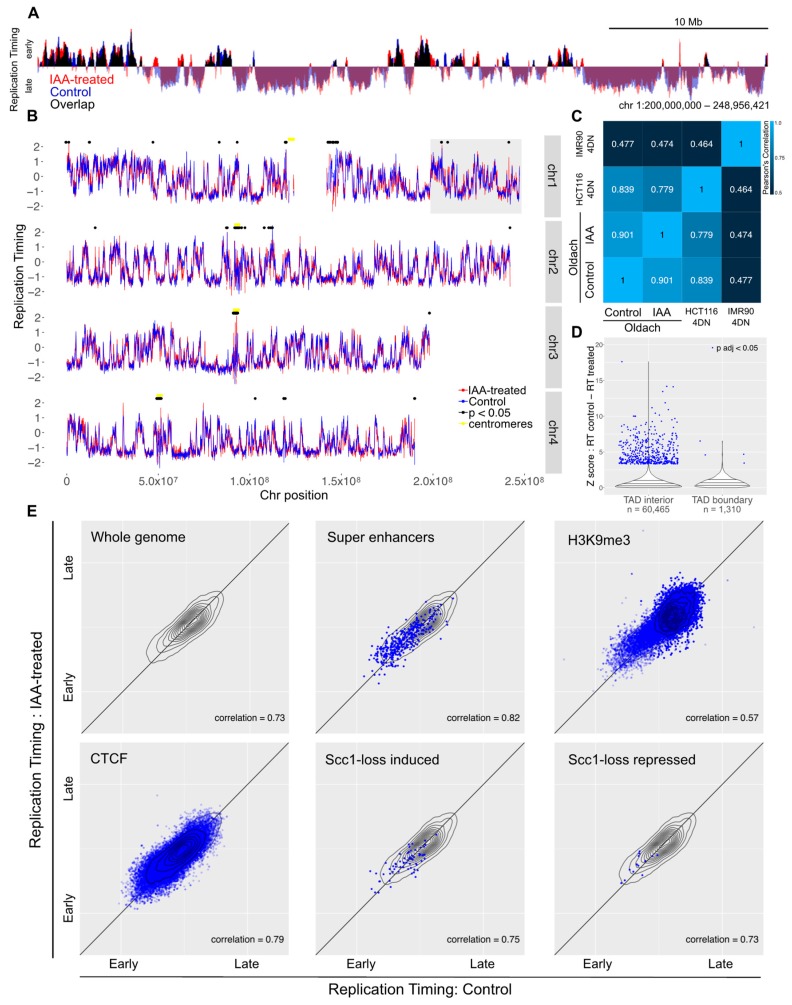
Figure 4.
Loss of cohesin from early G1 does not perturb replication timing. (A) Example locus overlay of replication timing (RT, log-scaled ratio of four hour timepoint read counts over ten hour timepoint counts) for auxin-treated versus control cells. (B) RT plots for four example chromosomes with significantly-changed loci marked with black dots. The gray box highlights the region shown in (A). (C) Pearson correlation calculated for RT values across the genome compared to previously-published 4D Nucleome RepliSeq data. (D) Violin plot showing the distribution of Z scores for control versus auxin-treated RT difference across the genome, separating out genomic bins covering a TAD boundary. (E) RT for control versus auxin-treated cells across the whole genome and across genomic coordinates annotated for super enhancers, H3K9me3, CTCF, and genes that showed induction or repression upon auxin treatment in the Scc1-mAID cell line. The gray topology plot in each subfigure shows the whole-genome behavior and genome features with dense annotations (CTCF and H3K9me3) have a topology map in dark blue.

