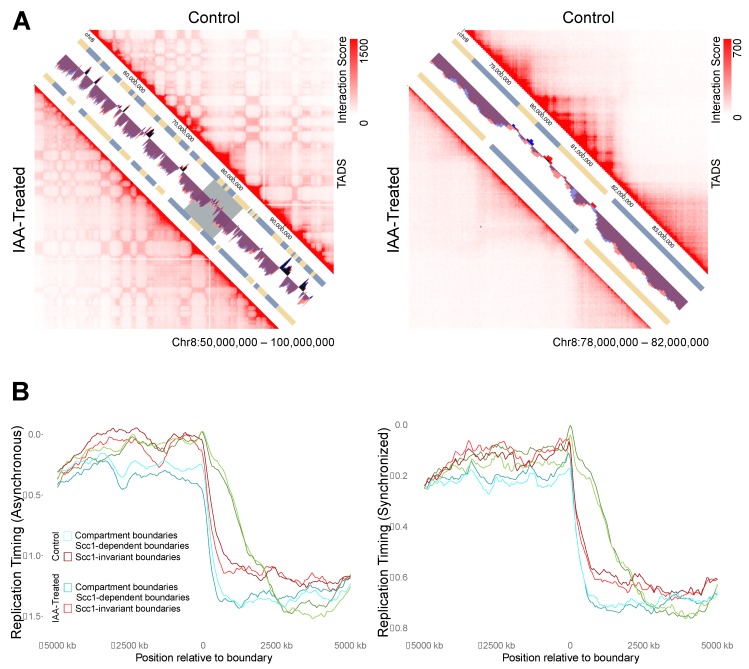
Figure 5.
Replication timing across TAD boundaries versus compartment boundaries. (A) Visualization of HiC data from Rao et al. (2017) [30] in untreated cells versus auxin-treated cells. The left panel spans 50 Mb to highlight compartments and the right zooms in to 6 Mb from within that locus (gray box) to highlight changes to TAD structure. (B) Replication timing metaplots for windows 5 Mb on either side of TAD boundaries. Invariant boundaries are those called in both control and auxin-treated cells, Scc1-dependent boundaries are those that were lost upon auxin treatment.

