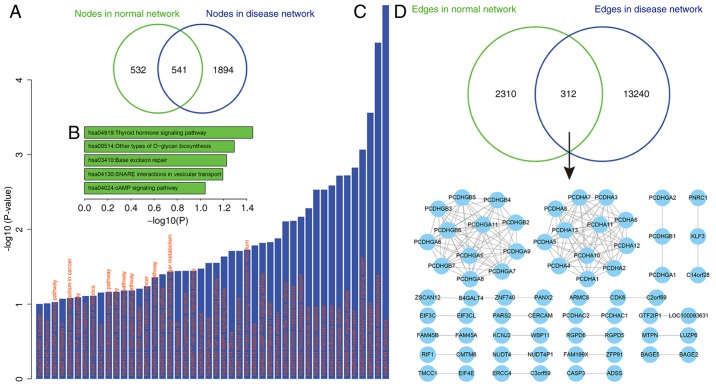
Figure 2.
Comparison of the ceRNA networks. (A) Comparison of the genes (ceRNAs) involved in the normal and depression networks. (B and C) Functional analysis of the ceRNAs. The x-axis represents the -log10 (P-value): (B) 5 pathways were annotated by ceRNAs specifically presented in the normal ceRNA network, and (C) 46 pathways (31 of which were significant) were annotated by ceRNAs specifically presented in the depression-associated ceRNA network. (D) Comparison of the edges (regulations) involved in the normal and depression networks (upper panel) and the core subnetwork shared by the two ceRNA networks (bottom panel). ceRNA, competitive endogenous RNA.

