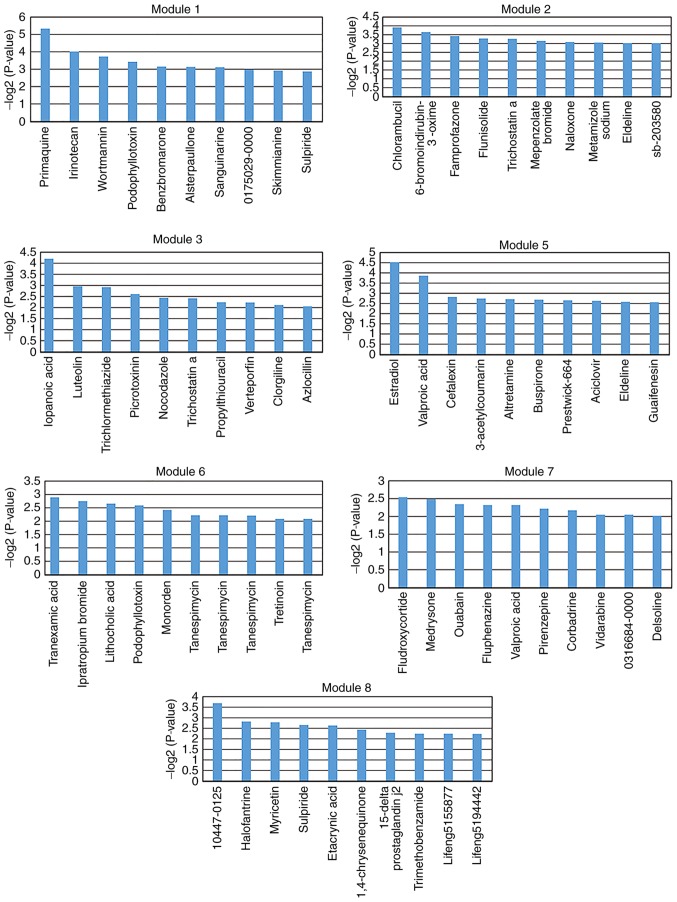
Figure 6.
Top 10 potentially relevant small molecules for fold-change values >2 or <0.5. The top 10 potentially relevant small molecules were screened for each key module (except module 4) based on the threshold of differential genes with fold-change values >2 or <0.5. The y-axis represents the log transformed significant P-value, which was calculated via the hypergeometric test.

