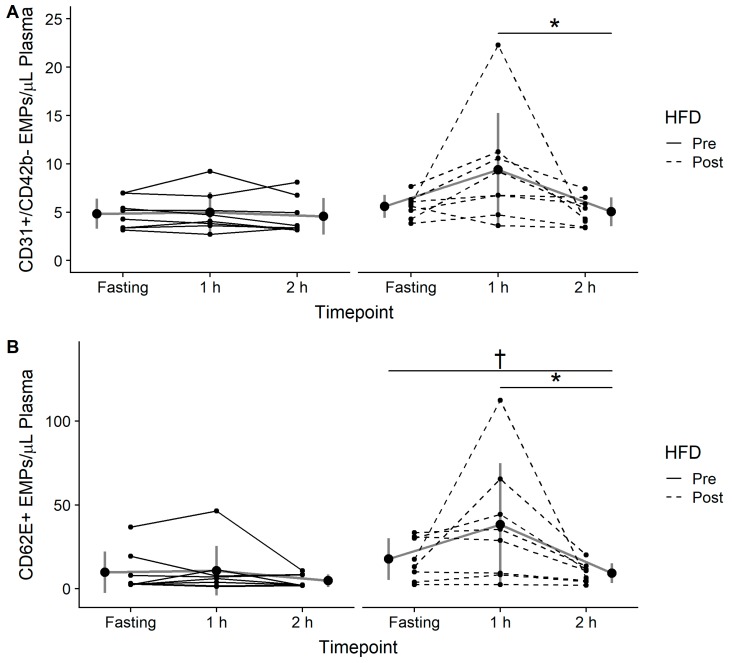
Figure 2.
(A) CD31+/CD42b- endothelial microparticles (EMPs) and (B) CD62E+ EMPs assessed in the fasting state (Fasting), 1-hour (1 h), and 2-hours (2 h) following consumption of a 75-g glucose drink pre and post 7-day high-fat diet (HFD). Data are expressed as the mean ± standard deviation (gray lines and large circles) and individually (solid and dashed black lines and small circles). Significant difference from 1 h to 2 h post-HFD is denoted as * (p < 0.05), significant difference from fasting to 2 h post-HFD is denoted as † (p < 0.05).

