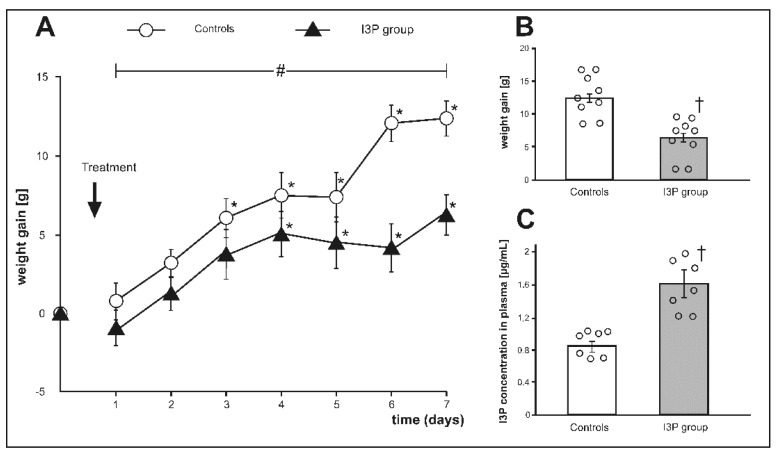
Figure 3.
(A) Changes in body weight during the experiment, (B) weight gain at the end of experiment, and (C) plasma indole-3-propionic acid (I3P) concentration at the end of experiment in Sprague Dawley rats treated with either indole-3-propionic acid (I3P group) or the vehicle (controls). * p < 0.05 vs. baseline, # p < 0.05 (time × group interaction) by ANOVA for repeated measurements, † p < 0.05 vehicle vs. I3P group. Means ± SE are presented, circles show individual data points.

