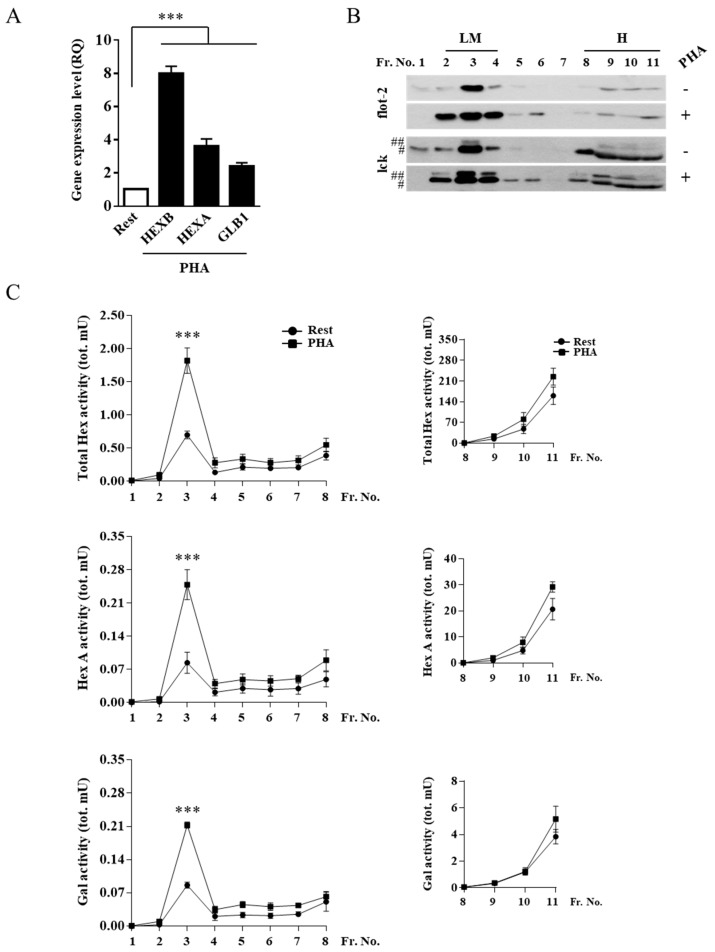
Figure 2.
Hex and Gal glycohydrolases increase their targeting to lipid microdomains after cell stimulation. (A) Gene expression analysis by Q-PCR of HEXB, HEXA, and GLB1 genes in resting and PHA-stimulated Jurkat cells. The ACTB gene was used as the endogenous control. The values are expressed as Relative Quantity (RQ). The mean ± SEM of three independent experiments is reported. *** p < 0.001 (PHA-stimulated vs. resting cells). Lipid microdomains were isolated from resting and PHA-stimulated Jurkat cells (1 × 10⁸) by a discontinuous sucrose-density gradient. (B) Fractions were collected from the top to the bottom of the tube and were analyzed by immunoblotting for flot-2 and lck (#, p56lck; ##, p60lck). Representative Western blotting of five independent experiments is reported. (C) Distribution of Total Hex, Hex A, and Gal enzymatic activities is expressed as total mU (tot. mU) in each fraction. Values are the mean ± SEM of five independent experiments. *** p < 0.001 (PHA-stimulated vs. resting cells). LM, lipid microdomain fractions; H, high-density fractions; Rest, resting cells; PHA, PHA-stimulated cells.

