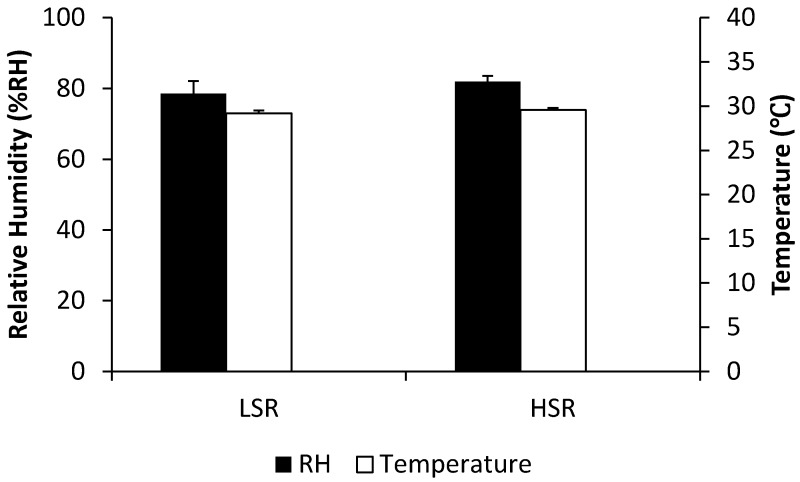
Figure 6.
Comparison of body-seat interface relative humidity (RH) when the sensor moves towards the left mid-thigh of the participant at two different velocities: lower speed rate (LSR; 0.17 cm/s ± 0.01 cm/s) and higher speed rate (HSR; 0.32 cm/s ± 0.01 cm/s). In addition, the temperature values at the contact surface for different speeds of sensor movement are illustrated along with RH. Error bars denote ±1 standard deviation.

