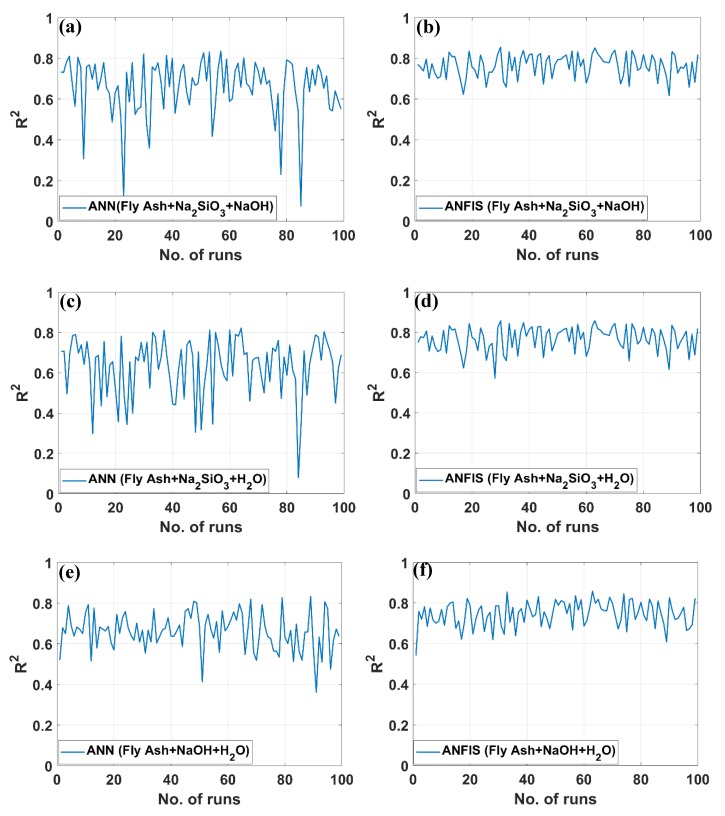
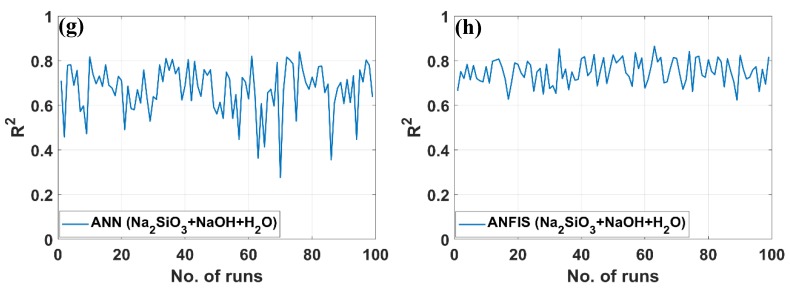
Figure 8.
Error distribution (R2) of ANN and ANFIS models using three input parameters for 100 different runs: (a) testing ANN of Fly Ash + Na2SiO3 + NaOH, (b) testing ANFIS of Fly Ash + Na2SiO3 + NaOH, (c) testing ANN of Fly Ash + Na2SiO3 + H2O, (d) testing ANFIS of Fly Ash + Na2SiO3 + H2O, (e) testing ANN of Fly Ash + NaOH + H2O, (f) testing ANFIS of Fly Ash + NaOH + H2O, (g) testing ANN of Na2SiO3 + NaOH + H2O, and (h) testing ANFIS of Na2SiO3 + NaOH + H2O.


