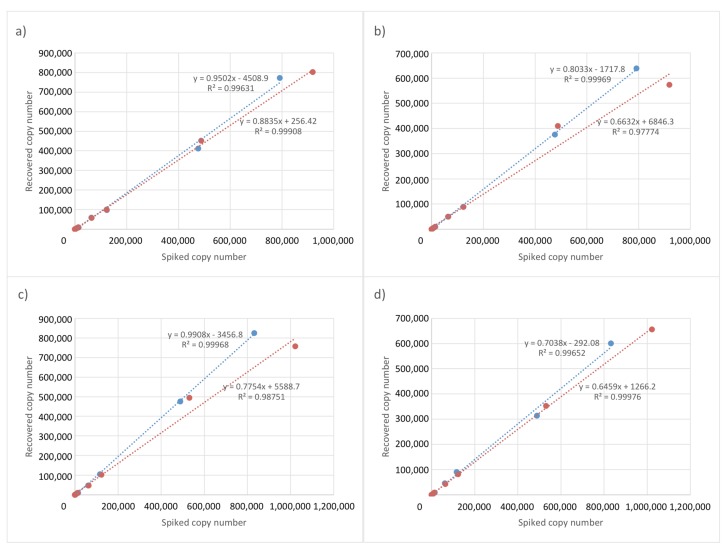
Figure 3.
Efficient and quantitative recovery using samples extracted from plasma and urine. (a) Plasma and (b) urine samples in EDTA collection tubes at day 1 and (c) plasma and (d) urine samples at day 2. Blue circles denote SET1, and red circles denote SET2. The horizontal axis shows the spiked copy number in 1 mL of plasma and urine, respectively, and the vertical axis shows copy numbers recovered from plasma and urine, respectively. The slope indicates the recovery rate.

