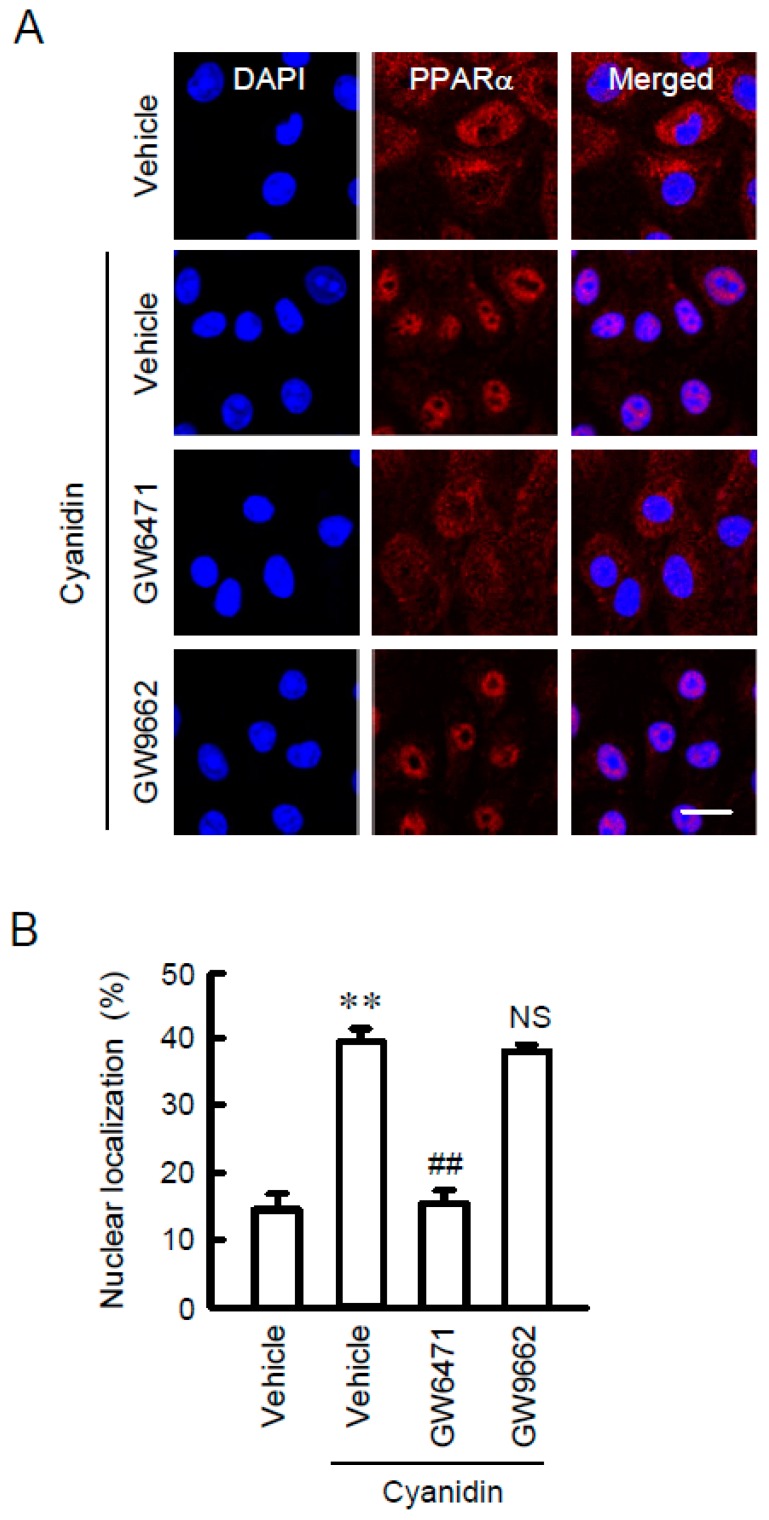
Figure 4.
Increase in nuclear localization of PPARα by cyanidin. (A) MCE301 cells were incubated with vehicle, 10 μM GW6471, or 10 μM GW9662 in the presence and absence of 10 μM cyanidin for 1 h. The cells were stained with anti-PPARα antibody (red) and DAPI (blue). Merged images are shown in the right. Scale bar indicates 20 μm. (B) The fluorescence intensities of PPARα in the nuclei were measured using Image J and represented relative to the values of total fluorescence intensities. n = 4. ** p < 0.01 compared without cyanidin. ## p < 0.01 and NS p > 0.05 compared with cyanidin alone.

