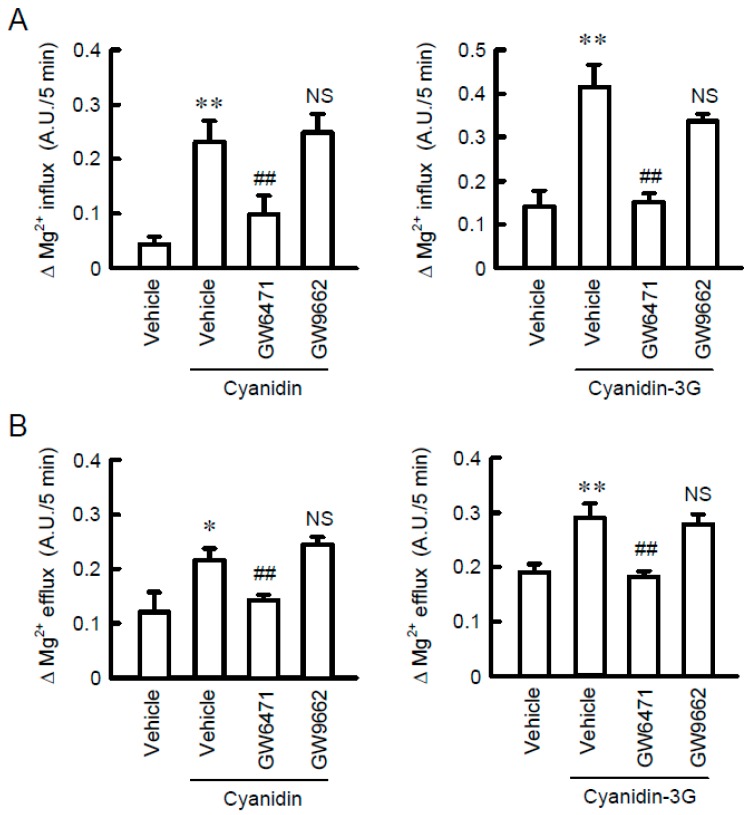
Figure 7.
Elevation of Mg2+ influx and efflux from cells by cyanidin. (A) MCE301 cells were incubated with vehicle, 10 μM GW6471, or 10 μM GW9662 in the presence of 10 μM cyanidin or 10 μM cyanidin-3G for 24 h. MgCl2 (1 mM) was added to the nominally Mg2+-free HBSS immediately after the start of the measurements. The increase in fluorescence values for 5 min was compared in each group. (B) The HBSS containing 1 mM MgCl2 was replaced to the nominally Mg2+-free HBSS immediately after the start of the measurements. The decrease in fluorescence values for 5 min was compared in each group. n = 4–6. ** p < 0.01 and * p < 0.05 compared without cyanidin. ## p < 0.01 and NS p > 0.05 compared with vehicle.

