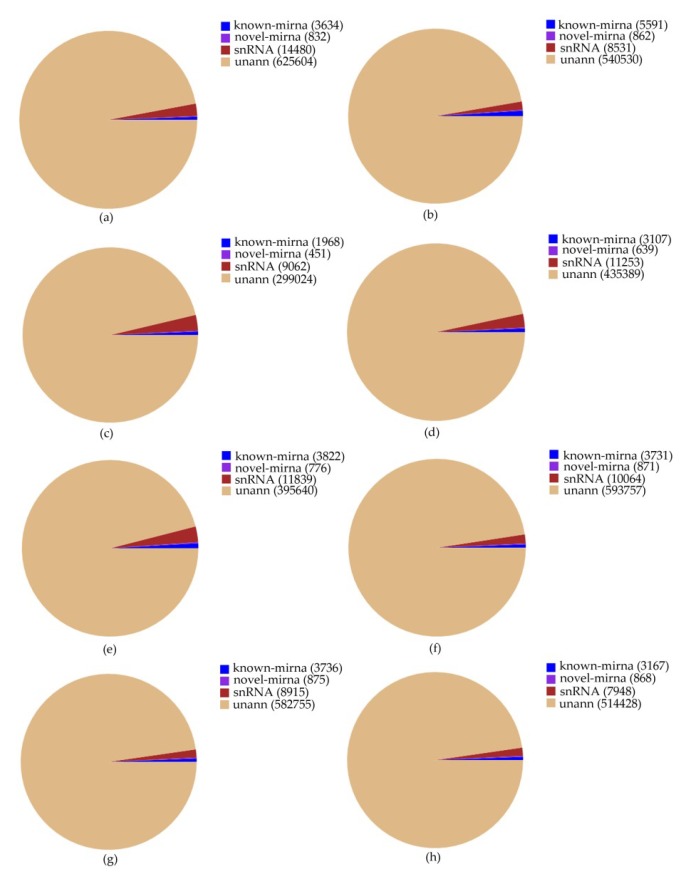
Figure 1.
Tag quantity and abundance statistics of different categories in eight small RNA libraries. CK, T1, T2 and T3 represent 0 h, 24 h, 36 h and 48 h MeJA treatment respectively and (a–h) represents CK-1, CK-2, T1-1, T1-2, T2-1, T2-2, T3-1, T3-2 respectively (two biological replicates for each treatment, named CK-1, CK-2, etc.).

