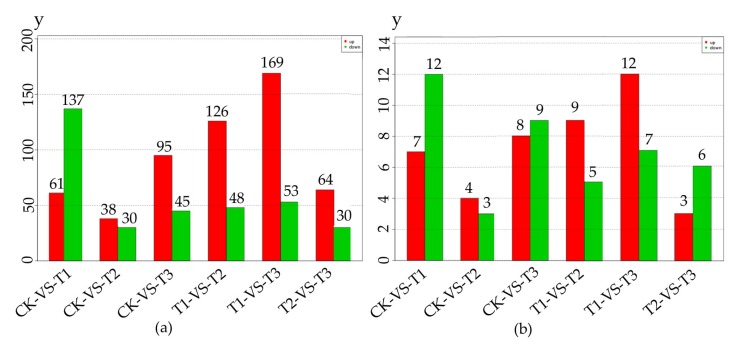
Figure 2.
The number of differentially expressed miRNA in 4 methyl jasmonate (MeJA) treatment groups. The numbers on the column showed the quantity of upregulated (red) and downregulated (green) miRNA. (a) The number of differentially expressed total miRNA; (b) The number of differentially known miRNA. CK, T1, T2 and T3 represented 0 h, 24 h, 36 h and 48 h MeJA treatments respectively. The y-axis represents the number of miRNA.

