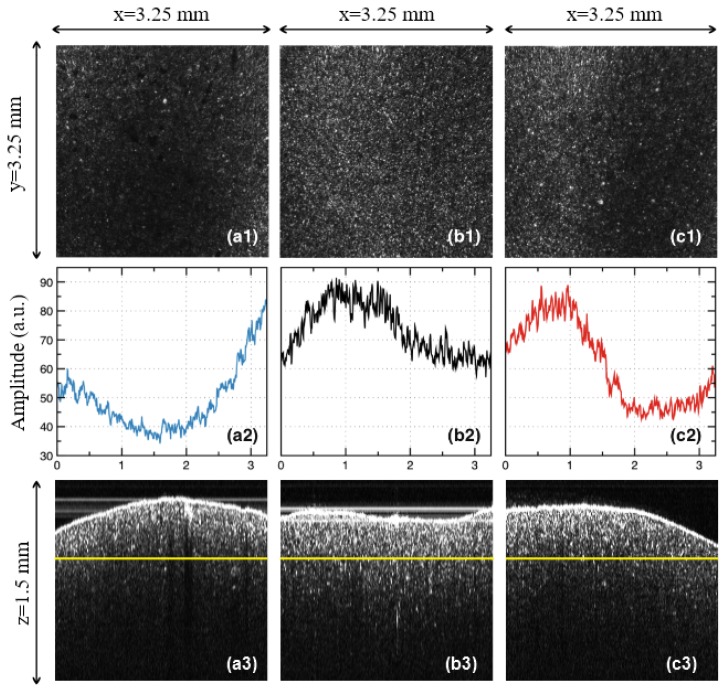
Figure 4.
Examples of the OCT study of the samples pressed at different temperatures: (a1–a3), Group L: sample pressed at 840 °C (50 °C below the normal temperature). (b1–b3), Group N: sample pressed at the normal temperature of 890 °C, prescribed by the manufacturer. (c1–c3), Group H: sample pressed at 940 °C (50 °C above the normal temperature). Steps of the analysis: Row (1), en face OCT image of the sample; Row (2), MATLAB processing of the en face OCT image; Row (3), B-scan (cross-section) OCT image—with the yellow line marking the sectioning plane used to obtain the en face OCT image (taken at a constant depth in the sample, considered from the zero OPD).

