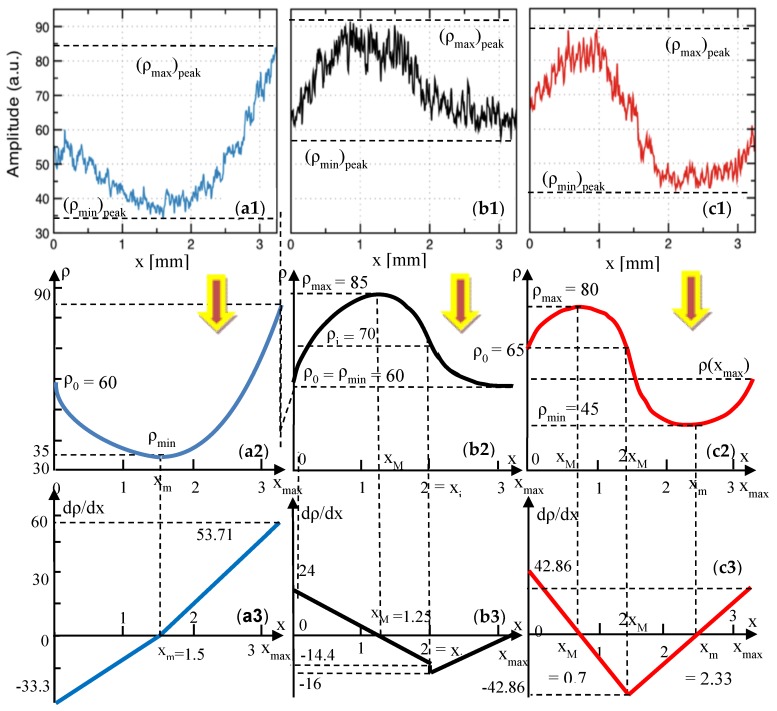
Figure 6.
(a1–a3), reflectivity profiles obtained using MATLAB from the en-face OCT images in Figure 4—for pressed ceramic. Row (2): reflectivity graphs, obtained as averages of these reflectivity graphs. Row (3): gradient of the reflectivity, obtained from Appendix A.1.1, Appendix A.1.2 and Appendix A.1.3, as well as shown in Table 1, Table 2 and Table 3, respectively. Column (a), Group L: sample pressed at 840 °C (50 °C below the normal temperature). (b1–b3), Group N: sample pressed at the normal temperature of 890 °C, prescribed by the manufacturer. (c1–c3), Group H, sample pressed at 940 °C (50 °C above the normal temperature).

