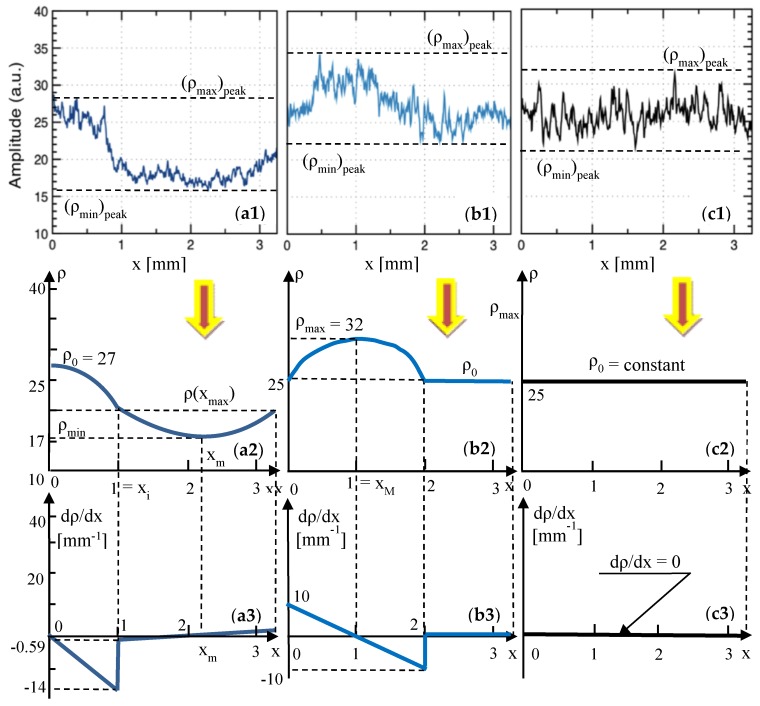
Figure 7.
Row (1): reflectivity profiles extracted from our previous work [11] (reproduced with permission from MDPI) from en-face OCT images for metal ceramic dental prostheses. Rows (2) and (3): reflectivity graphs (i.e., averages of the reflectivity profiles) and gradient of the reflectivity, respectively, obtained from Appendix B.1.1 and Appendix B.1.2, and shown in Table 4 and Table 5. (a1–a3), Group L100: for the sample pressed at 830 °C (100 °C below the normal temperature). (b1–b3), Group L30: for the sample pressed at 900 °C (30 °C below the normal temperature). (c1–c3), Group N: for the sample pressed at the normal temperature of 930 °C, prescribed by the manufacturer.

