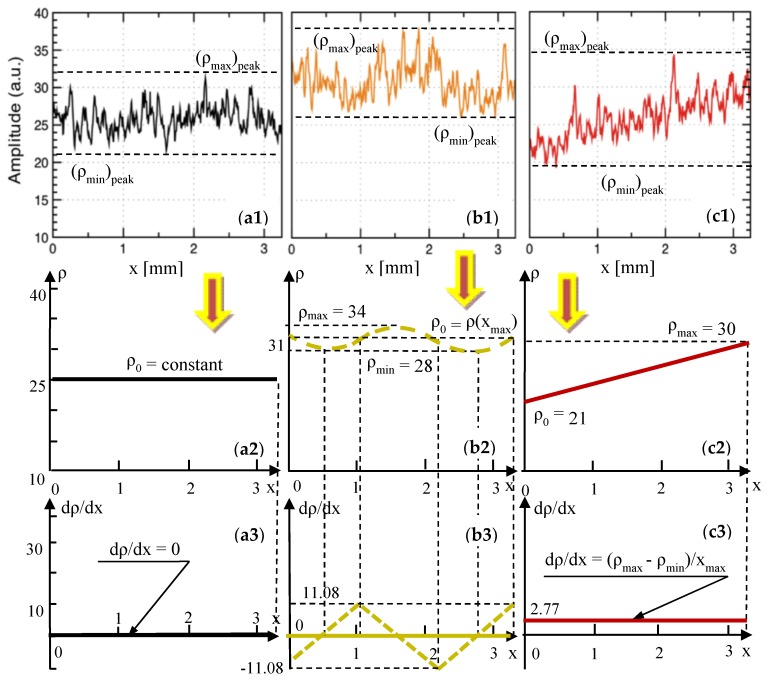
Figure 8.
Row (1): reflectivity profiles, extracted from our previous work [11] (reproduced with permission from MDPI) from en-face OCT images for metal ceramic dental prostheses. Rows (2) and (3): reflectivity graphs (i.e., averages of the reflectivity profiles) and gradient of the reflectivity, respectively, obtained from Appendix B.1.3 and in the text, as well as shown in Table 6, for Group H30. (a1–a3), Group N: for the sample pressed at the normal temperature of 930 °C, prescribed by the manufacturer. (b1–b3), Group H30: for the sample pressed at 960 °C (30 °C above the normal temperature). (c1–c3), Group H50: for the sample pressed at 980 °C (50 °C above the normal temperature).

