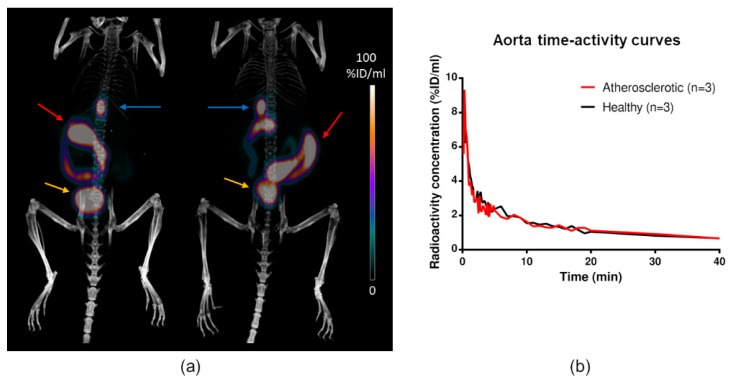
Figure 5.
Examples of [18F]Flutemetamol in vivo PET/CT images. (a) PET/CT of a healthy C57BL/6N mouse (left) and atherosclerotic IGF-II/LDLR−/−ApoB100/100 mouse (right) at 30 min post-injection. High radioactivity is seen in the gallbladder (blue arrows), intestine (red arrows), and urinary bladder (yellow arrows). The kidneys are also faintly visible. (b) Time-activity curves in aorta show no difference between the atherosclerotic and healthy mice.

