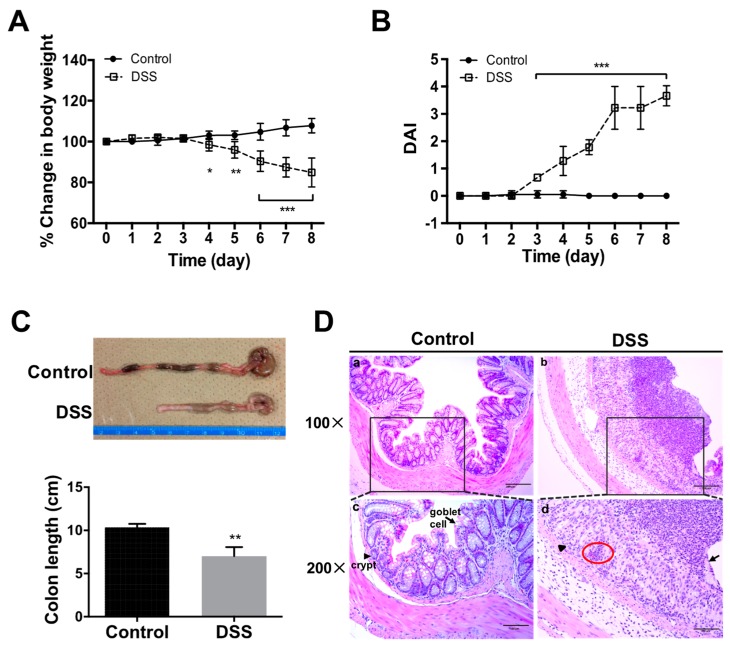
Figure 2.
Macro- and microscopic changes to bowel in mice with DSS-induced colitis. Changes in body weight (A) and disease activity index (DAI) (B) were evaluated daily. Colon length was measured after sacrifice (C). Hematoxylin and eosin (HE) staining (D) showed distortion of crypts (arrowhead), loss of goblet cells (arrow), and infiltration of inflammatory cells (red circle) in colon sections from DSS-treated mice. All values are given as mean ± SEM (n = 6 mice); * p < 0.05, ** p < 0.01, and *** p < 0.001 vs. control. Scale bars: 200 μm (a,b); and 100 μm (c,d).

