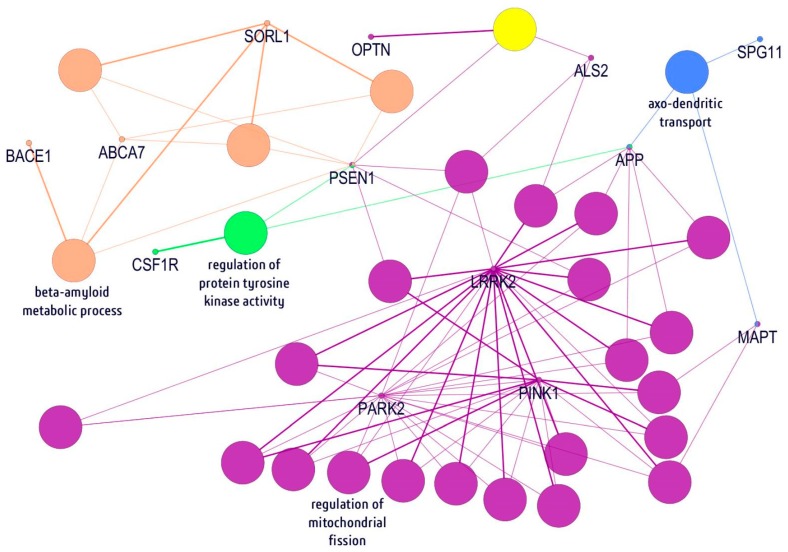
Figure 2.
Visualization of neurodegenerative disorders of 23 genes in network modules. Each biological process was represented with the nodes which are connected with lines to indicate interactions. The orange nodes indicated beta-amyloid metabolic process genes, while regulation of protein tyrosine kinase activity and mitochondrial fission genes are presented as green/yellow and purple, respectively. The light-blue nodes revealed genes associated with axo-dendritic transport.

