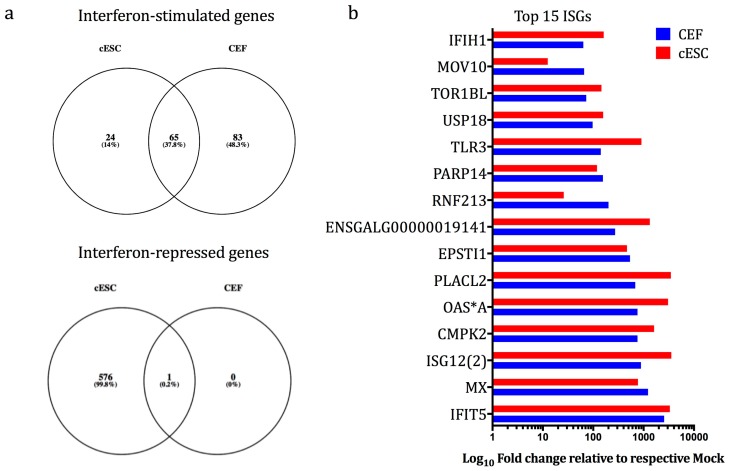
Figure 4.
(a) Venn diagrams showing the distribution of unique and shared up- and down-regulated transcripts in interferon (chIFN-α)-stimulated CEF and cESC. The numbers in the intersections of each circle represents the number of transcripts common to each condition (FDR ≤ 0.05 and fold change ≥±3.0). (b) Differential expression (log10 fold-change related to respective mock samples) of the top 15 ISGs (fold change ≥|±3.0| and FDR ≤ 0.05) as identified in cESC and CEFs [25] following chIFN-α stimulation (Supplementary file 1).

