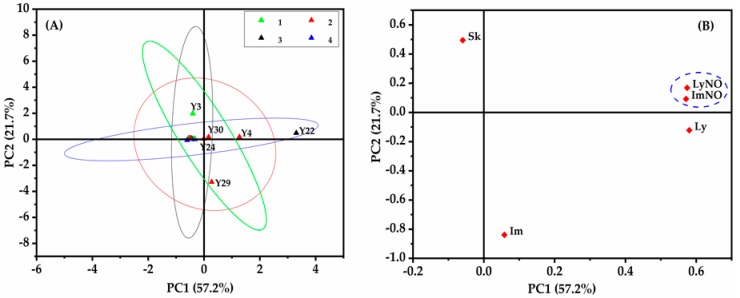
Figure 9.
Principal component analysis of A. capillaris with the PAs daily intake above the baseline based on the contents of 5 main detected PAs analytes. (A) Score plots of PCA for 16 samples with different sources, where Group 1 are samples from North China, Group 2 from East China, Group 3 from the Northwest and Group 4 from Central-south and Southwest China; (B) loading plots of PCA for five main analytes to illuminate the relationship between PAs detected in A. capillaris.

