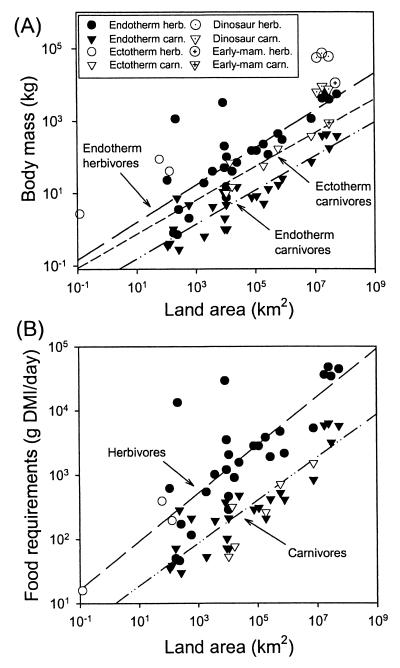
Figure 1.
(A) Body masses of top endothermic and ectothermic carnivores and herbivores, as a function of Holocene area of landmass inhabited. Separate regression lines are fitted through the points for each set of species except for ectothermic herbivores, which were not fitted because we have only three data points. Slopes of the lines are 0.47–0.52 and do not differ significantly between the species sets (P > 0.60). Note that larger landmasses support larger top species, and that, for a given area of landmass, body masses decrease in the sequence: ectothermic herbivore (○) > endothermic herbivore (●) > ectothermic carnivore (▿) > endothermic carnivore (▾). The two deviant points (●) at 3,200 kg, 8,259 km2 and at 1,150 kg, 209 km2 are the Crete dwarf elephant and the Santa Rosa dwarf mammoth, respectively, discussed in the text. Dinosaurs and early mammals are coded separately and discussed in the text. (B) Daily food requirements [grams of dry matter intake (GMI) per day] of top species (coded by the same symbols as in A), as a function of Holocene area of landmass inhabited. Because of an ectotherm's lower metabolic rate per gram of body mass, its food requirements are lower than those of an endotherm of the same body mass. As a result, B shows that an ectothermic top carnivore (▿, reptile) has the same food requirements (P > 0.10) as a endothermic top carnivore (▾, mammal or bird) on a landmass of the same area (and similarly for herbivores, ● vs. ○), although A showed that the ectotherm had the larger body mass. The two lines have the same slope (P = 0.57).

