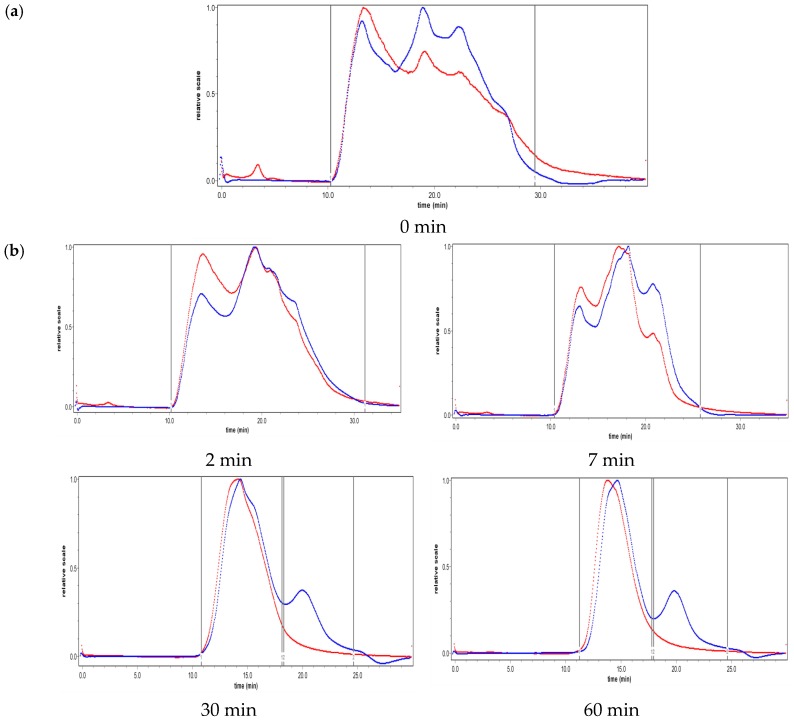
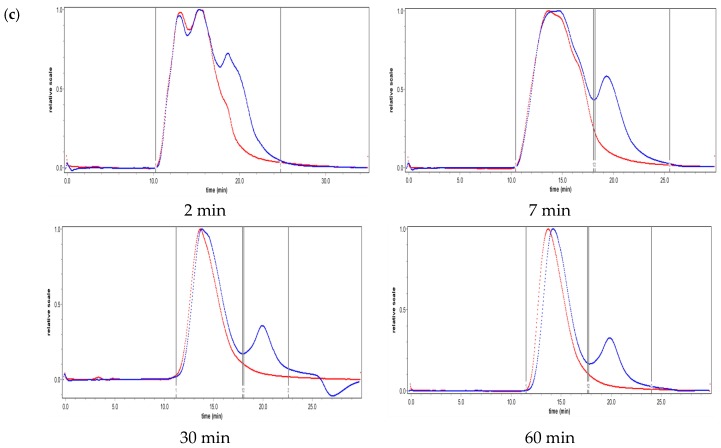
Figure 2.
Effect of ultrasonic treatment on molecular weight distribution: (a) before ultrasonic treatment, (b) 270 W ultrasonic treatment, and (c) 390 W ultrasonic treatment. The red line represents the result of the light scattering detector, and the blue line represents the result of a differential refractive index detector.


