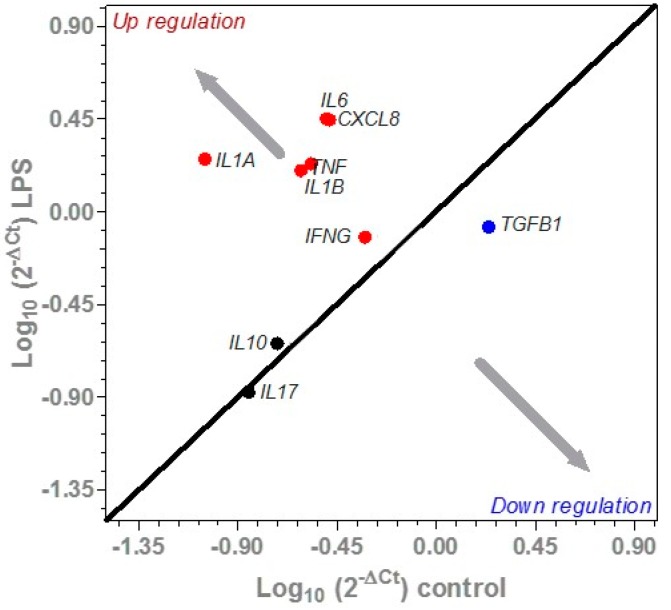
Figure 4.
Differences in the expression of a selected panel of cytokine genes between unchallenged and lipopolysaccharide (LPS) challenged ex vivo colonic tissues. The red dots represent significant upregulated genes (p < 0.05), the blue dot represents a significant downregulated gene (p < 0.05) and the black dots represent genes not affected by LPS (p > 0.05).

