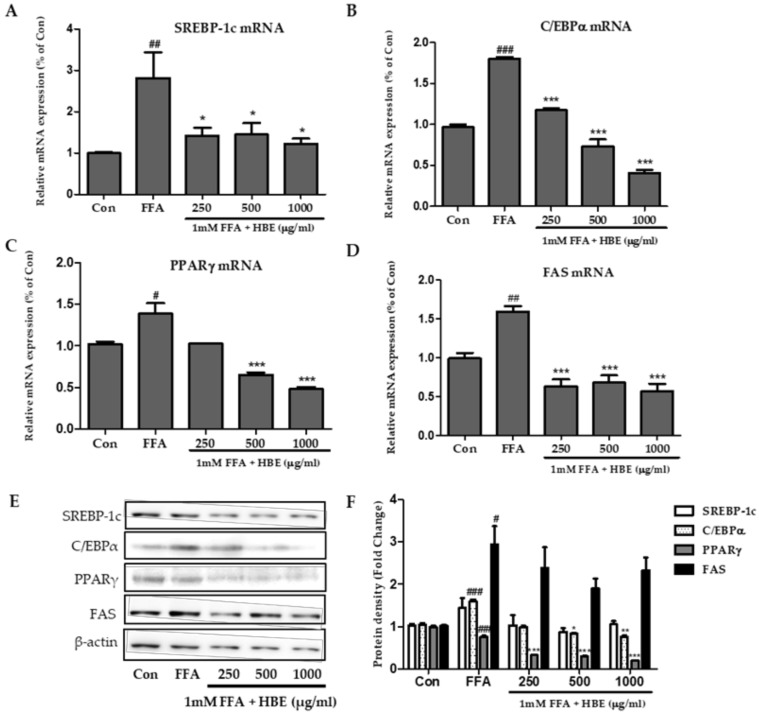
Figure 4.
Effects of HBE on the expression of genes associated with lipogenesis in HepG2 cells. (A–D) The expressions of SREBP-1c (A), C/EBPα (B), PPARγ (C), and fatty acid synthase (FAS) (D) were quantified by real-time PCR and normalized by β-actin as an internal control. (E) SREBP-1c, C/EBPα, PPARγ, and FAS protein levels were monitored by Western blot analysis. (F) Protein density of SREBP-1c, C/EBPα, PPARγ, and FAS. Equal loading of protein was verified by probing β-actin. Data represent means ± SD. # p < 0.5, ## p < 0.01, ### p < 0.001 vs. Con; * p < 0.05, ** p < 0.01, *** p < 0.001 vs. free fatty acids (FFA).

