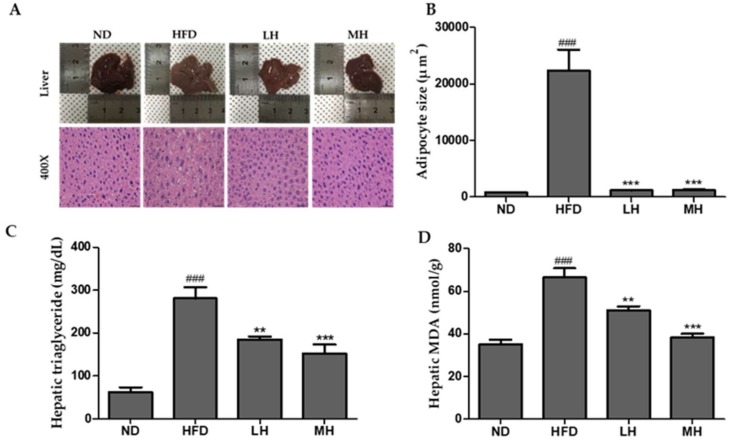
Figure 6.
Effect of HBE treatment on hepatic steatosis in normal or HFD-fed mice. (A) Liver tissue histology (400×). (B) Adipocyte sizes of ND, HFD, LH, and MH. (C) The accumulation of liver TG. (D) Hepatic MDA levels. ND, normal diet control; HFD, high-fat diet; LH, HFD-supplemented 0.5% HBE; MH, HFD-supplemented 1% HBE. The results from three independent experiments are expressed as the mean ± SD. ### p < 0.001 vs. ND; ** p < 0.01, *** p < 0.001 vs. HFD.

