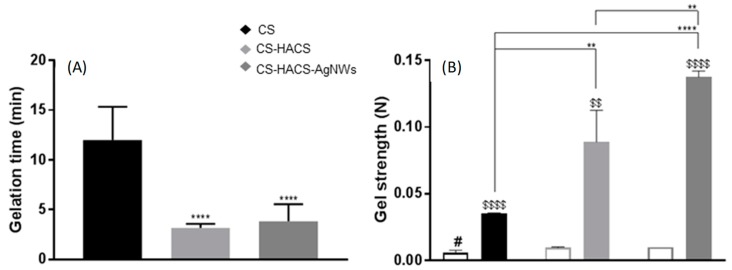
Figure 2.
Physical characterization of the hydrogels: Chitosan (CS, black), chitosan gel with chitosan hydroxyapatite composite (CS-HACS, light grey) and chitosan gel with chitosan hydroxyapatite composite and silver nanowires (CS-HACS-AgNWs, dark grey). (A) Gelation time calculated by the inverted tube method. Data are reported as mean ± SD (n = 9). One-way Analysis of Variance (ANOVA) returned p < 0.0001. Post-hoc Tukey’s comparison test results are shown in the graph: **** indicates p < 0.0001 as compared to the control (CS); (B) Gel strength calculated by texture analysis before (empty bars) and after (filled bars) gelation. Data are represented as mean ± SD (n = 3). The t-test performed on all samples before and after gelation showed significantly different strength values for all gels ($$ indicates p < 0.01 and $$$$ p < 0.0001). One-way ANOVA to compare the different formulations returned p < 0.01 before and p < 0.0001 after gelation. Post-hoc Tukey’s test results showed that before gelation only CS is different from all other gels (# p < 0.05), while the individual results for after gelation are reported on the graph (** p < 0.01; **** p < 0.0001).

