Figure 3.
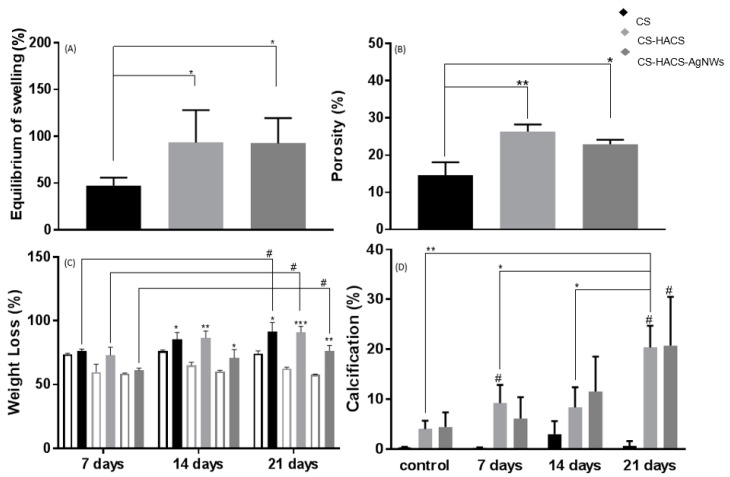
Further physical characterization, enzymatic degradation and bioactivity determination of hydrogels: CS (black), CS-HACS (light grey) and CS-HACS-AgNWs (dark grey). (A) Equilibrium swelling (Q%), data are reported as mean ± SD (n = 6). One-way ANOVA returned p < 0.05, results of the post-hoc Tukey’s multi-comparison test are reported in the graph (* p < 0.05); (B) Gels porosity determined by gravimetric method, data are reported as mean ± SD (n = 3). One-way ANOVA returned p < 0.05, results of the post-hoc Tukey’s multi-comparison test are reported in the graph, (* p < 0.05 and ** p < 0.01); (C) Gels degradation in the presence of lysozyme (full bars), the empty bars represent the relative control gels treated in PBS; data are reported as mean ± SD (n = 3). One-way ANOVA returned p < 0.05, results of the post-hoc Tukey’s multi-comparison test are reported in the graph (# p < 0.05). A t-test was performed against the PBS incubated samples for each gel at each time point; * p < 0.05, ** p < 0.01 and *** p < 0.01; (D) Percentage surface calcification of hydrogels incubated at 37°C in SBF for 7, 14 and 21 days as calculated by image analysis via ImageJ and BoneJ from SEM images. Controls were only incubated for few hours in deionized water. Results are reported as mean ± SD (n = 3). Samples labeled with the symbol # resulted to be significantly different from their control sample (p < 0.05). One-way ANOVA returned p < 0.05 only when testing CS-HACS at different time points, the results of the post-hoc Tukey’s multi-comparison test are reported in the graph (* p < 0.05, ** p < 0.01).

